


It is commonly believed K12 students had significant learning losses as a result of Covid. How is the recovery going in Highline, other nearby districts, and in the state as a whole?
The newest test data has discouraging news. Just released on the Washington State Report Card in the past week by the Office of the Superintendent of Public Instruction (OSPI), the data shows:
- Highline student scores in English and Math in spring 2023 are much lower than the scores in spring 2019.
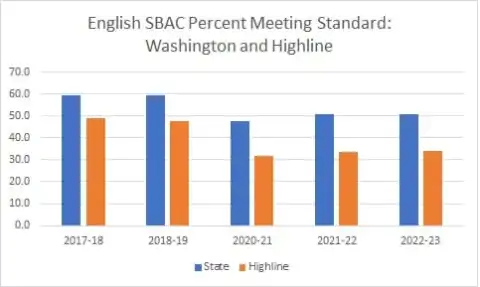
- English Language Arts (ELA): 34% met standard in 2022-23, compared to 47.5% for 2018-19
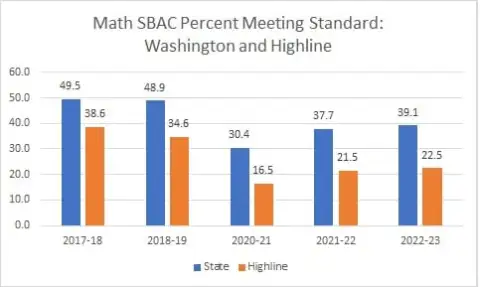
- Math: 22.5% met standard in 2022-23, compared to 34.6% for 2018-19
- Science scores are also low, but the drop of 3.5% is not as big. For 2022-23, 27.9% met standard, compared to 31.4% in 2018-19.
- For all three tests, there has not been a significant rebound in the past year: the 2022-23 scores are just 0.6% to 1.1% above the scores of 2021-22.
There are many ways to compare test data of school districts and the state as a whole. For this story, I compare Highline to Auburn, Federal Way, Kent, Renton, Seattle, and Tukwila, as well as the state totals. I look first at changes from pre-Covid to now and second at the absolute levels. For a different perspective, focused almost exclusively on the state, the Seattle Times ran a front-page story about the 2022-23 test data on September 14, 2023.
All Washington state students in grades 3-8 and 10 take tests on English and Math. The science test is given in grades 5, 8, and 11. As outlined in a previous Burien News story on tests, “meeting standard” is defined as getting a 3 or 4 on the SBAC. If the students get a 1 or 2, they are below standard. The state reports the percentage of students who meet the standard.

 Some notable points when comparing differences between pre-Covid and current test scores for the state and individual districts:
- For English, the state as a whole is 8.9% lower in 2022-23 than in 2018-19. Highline’s drop is 13.5%.
a. This is the biggest drop out of the seven districts I looked at. Seattle has the least drop, at 6.2%. - For Math, the state as a whole is 9.8% lower in 2022-23 than in 2018-19.
a. Highline is 12.1% lower.
b. This is a bigger drop than all but Auburn, out of the seven districts I reviewed. Auburn had a decline of 14.1%. - For Science, the story is less discouraging: Highline is tied with Seattle as having the least drop, at 3.5%.
a. Auburn had the worst drop, at 7.9%.
Looking at changes is one way to interpret data. Another is to look at only the most recent numbers. This data, to me, is even more discouraging than the lack of recovery. Highline numbers are very low.
- For English in 2022-23, just 34% of students met the standard—the state total: 50.7%.
a. Tukwila was below Highline, at 29.7%. Federal Way was 34.7%, so just barely ahead of Highline.
b. Three districts were at 43 to 46%, and Seattle – very surprising to me, 63.6%. In other words, the percentage of students in Seattle who met ELA standards post-COVID is nearly double the percent in Highline.
If you read comments in the Seattle Times story, there are many complaints about Seattle math, Seattle outcomes, Seattle this, and Seattle that, but the reality is those kids are far outperforming Highline (as well as all districts in south King County.) Seattle scores are far closer to the Eastside districts than they are to south King County districts.
Here’s an example: a quick glance at the state report card data shows that Seattle’s English percent meeting standard score is 17.6 percent lower than Mercer Island’s. In comparison, Seattle’s English scores are 29.6 percent higher than Highline’s English percent, meeting the standard.
For Math, Highline, with 22.5% meeting standard, is again far lower than the state math total of 39.1%.
- Of the local districts, Highline is ahead only of Tukwila, where 19.2% met the standard.
- Federal Way is 22.6%, so a smidgen ahead of Highline’s 22.5%. And the others:
- Seattle, this time more than doubles Highline’s percentage, with 53.5% meeting the standard.
- The other four nearby districts are 31 to 36%, which is significantly higher than Highline.
Opinion
There are many discouraging conclusions one can draw from these numbers. Highline was a very low-performing district pre-Covid, and in the past two years (21-22 and 22-23), test scores have not returned even to those low levels. Now that the CARES money for Covid relief is ending, what’s next?
Well, I think one certainty is these are hard numbers to discuss. I can imagine a lot of people in education would rather discuss any number of social topics instead of test scores and poor academic outcomes!
Yet visibility is key to fixing any problem, as opposed to following a “primrose path” that transcends into more discussions about emotions or the structure of society and more contracts with consultants who claim to have magic potions but provide no data whatsoever on their website of actual outcomes.
Learning is cumulative. What happens in any year builds on what happened previously. Unfortunately, many schools are not set up for extensive re-teaching (or first teaching) and remediation for 70 to 80% of the students who are nowhere close to meeting the standards they are supposed to know at the start of a year.
A reality: there are only so many hours in the school day and school year. The Seattle Times story has some very good interviews with people running math programs who discuss promising approaches. The report also points out there will be increased reporting requirements soon for all the Covid money, so maybe we’ll find out where the billions nationwide went.
Unfortunately, parents likely need to do a lot of extra work to help their children with foundational skills. A question, though, is whether parents even know what their kids’ gaps are. This is not just the fault or responsibility of the school district: parents have got to step up, take the initiative, and work with the dedicated teachers and administrators who, in my opinion, care a lot about children. The teachers and administrators can’t do everything!
Watch for future, more in-depth stories on elementary, middle, and high school test results for the Highline district.
Data in Depth: Overview
This data table shows how the Highline School District compares overall to the state scores and to the scores of districts in the area:
| 2022-23 | All of WA | Highline | Auburn | Federal Way | Kent | Renton | Seattle | Tukwila |
| Math | 39.1% | 22.0% | 31.6% | 22.6% | 34.2% | 35.3% | 53.5% | 19.2% |
| ELA | 50.7 | 34.0 | 43.0 | 34.7 | 46.4 | 43.8 | 63.6 | 29.1 |
| Science | 42.9 | 27.9 | 32.9 | 25.3 | 38.9 | 35.6 | 48.3 | 20.3 |
Data in Depth: Math
Here are five years of Math test results (note there was no math test given in the 2019-20 school year, and the 2020-21 test schedule for the spring was instead given in Fall of 2021. Grades 3 – 8 and 10.
| 2017-18 | 2018-19 | 2020-21 | 2021-22 | 2022-23 | |
| State | 49.5 | 48.9 | 30.4 | 37.7 | 39.1 |
| Highline | 38.6 | 34.6 | 16.5 | 21.5 | 22.5 |
| Auburn | 49.1 | 45.7 | 20.3 | 30.2 | 31.6 |
| Federal Way | 34.5 | 33.4 | 16.0 | 21.7 | 22.6 |
| Kent | 47.8 | 46.1 | 27.7 | 33.7 | 34.2 |
| Renton | 47.2 | 46.0 | 27.9 | 32.5 | 35.3 |
| Seattle | 62.5 | 61.6 | 43.5 | 51.6 | 53.5 |
| Tukwila | 34.7 | 30.1 | 15.1 | 16.7 | 19.2 |
This shows year to year changes in math
| 2018-19 | 2020-21 | 2021-22 | 2022-23 | |
| State | -0.6 | -18.5 | 7.3 | 1.4 |
| Highline | -4.0 | -18.1 | 5.0 | 1.0 |
| Auburn | -3.4 | -25.4 | 9.9 | 1.4 |
| Federal Way | -1.1 | -17.4 | 5.7 | 0.9 |
| Kent | -1.7 | -18.4 | 6.0 | 0.5 |
| Renton | -1.2 | -18.1 | 4.6 | 2.8 |
| Seattle | -0.9 | -18.1 | 8.1 | 1.9 |
| Tukwila | -4.6 | -15.0 | 1.6 | 2.5 |
2022-23 Math compared to 2018-19
| State | -9.8 |
| Highline | -12.1 |
| Auburn | -14.1 |
| Federal Way | -10.8 |
| Kent | -11.9 |
| Renton | -10.7 |
| Seattle | -8.1 |
| Tukwila | -10.9 |
Data in Depth: English
Here are five years of English test results (note there was no test given in the 2019-20 school year, and the 2020-21 test schedule for the spring was instead given in Fall of 2021. Grades 3 – 8 and 10.
| 2017-18 | 2018-19 | 2020-21 | 2021-22 | 2022-23 | |
| State | 59.4 | 59.6 | 47.7 | 50.7 | 50.7 |
| Highline | 48.8 | 47.5 | 31.9 | 33.4 | 34.0 |
| Auburn | 55.9 | 55.4 | 33.8 | 43.6 | 43.0 |
| Federal Way | 46.0 | 45.8 | 31.6 | 35.6 | 34.7 |
| Kent | 57.5 | 56.2 | 46.9 | 47.9 | 46.4 |
| Renton | 55.0 | 53.9 | 38.8 | 42.9 | 43.8 |
| Seattle | 69.0 | 69.8 | 59.6 | 62.7 | 63.6 |
| Tukwila | 41.5 | 39.0 | 31.8 | 29.6 | 29.1 |
This shows year to year changes in English
| 2018-19 | 2020-21 | 2021-22 | 2022-23 | |
| State | 0.2 | -11.9 | 3.0 | 0.0 |
| Highline | -1.3 | -15.6 | 1.5 | 0.6 |
| Auburn | -0.5 | -21.6 | 9.8 | -0.6 |
| Federal Way | -0.2 | -14.2 | 4.0 | -0.9 |
| Kent | -1.3 | -9.3 | 1.0 | -1.5 |
| Renton | -1.1 | -15.1 | 4.1 | 0.9 |
| Seattle | 0.8 | -10.2 | 3.1 | 0.9 |
| Tukwila | -2.5 | -7.2 | -2.2 | -0.5 |
2022-23 English compared to 2018-19
| State | -8.9 |
| Highline | -13.5 |
| Auburn | -12.4 |
| Federal Way | -11.1 |
| Kent | -9.8 |
| Renton | -10.1 |
| Seattle | -6.2 |
| Tukwila | -9.9 |
Data in Depth: Science
Here are five years of Science test results (note there was no test given in the 2019-20 school year, and the 2020-21 test schedule for the spring was instead given in Fall of 2021.
| 2017-18 | 2018-19 | 2020-21 | 2021-22 | 2022-23 | |
| State | 46.3 | 46.7 | 45.8 | 42.7 | 42.9 |
| Highline | 33.9 | 31.4 | 31.4 | 26.8 | 27.9 |
| Auburn | 39.1 | 40.8 | 39.9 | 35.1 | 32.9 |
| Federal Way | 31.4 | 29.3 | 32.1 | 27.1 | 25.3 |
| Kent | 45.7 | 43.1 | 50.2 | 39.7 | 38.9 |
| Renton | 43.0 | 40.2 | 35.7 | 33.3 | 35.6 |
| Seattle | 53.3 | 51.8 | 44.1 | 48.5 | 48.3 |
| Tukwila | 33.4 | 32.0 | 14.6 | 26.1 | 20.3 |
This shows year to year changes in Science
| 2018-19 | 2020-21 | 2021-22 | 2022-23 | |
| State | 0.4 | -0.9 | -3.1 | 0.2 |
| Highline | -2.5 | 0.0 | -4.6 | 1.1 |
| Auburn | 1.7 | -0.9 | -4.8 | -2.2 |
| Federal Way | -2.1 | 2.8 | -5.0 | -1.8 |
| Kent | -2.6 | 7.1 | -10.5 | -0.8 |
| Renton | -2.8 | -4.5 | -2.4 | 2.3 |
| Seattle | -1.5 | -7.7 | 4.4 | -0.2 |
| Tukwila | -1.4 | -17.4 | 11.5 | -5.8 |
2022-23 Science compared to 2018-19
| State | -3.8 |
| Highline | -3.5 |
| Auburn | -7.9 |
| Federal Way | -4.0 |
| Kent | -4.2 |
| Renton | -4.6 |
| Seattle | -3.5 |
| Tukwila | -11.7 |