Councilmembers routinely get anonymous emails advocating for some issue–often using hyperbolic language. I got one this week saying “Vaccine Mandates Are Slavery!” To which I reply: No, dude. Slavery is slavery. But OK, being told you have no choice to get a vaccine is, to some degree, a loss of freedom. I’m not trying to
...
continue reading.
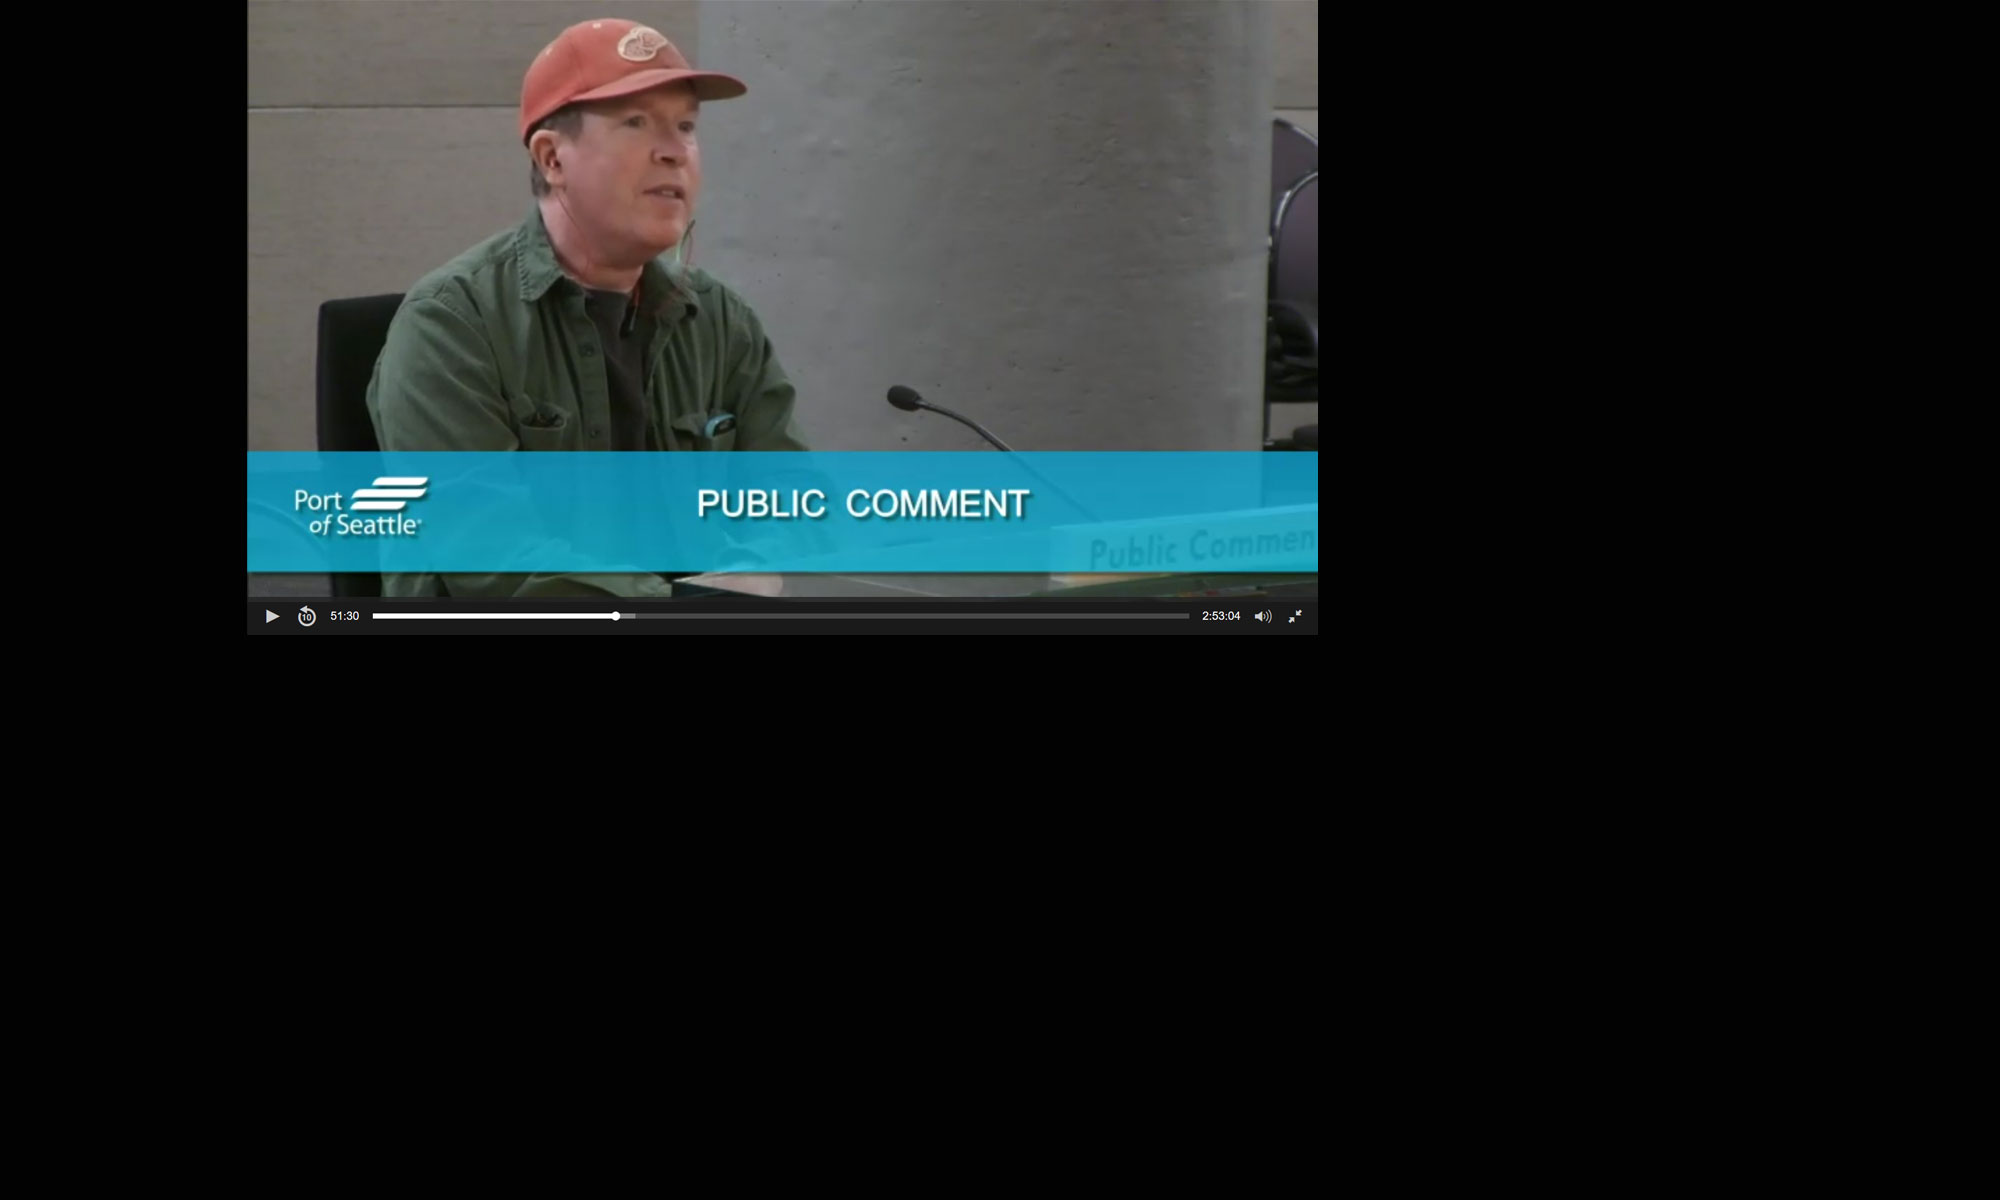
The City is making good on a proposal I made at our June 20th City Council Meeting to publish the video of Committee Meetings. The first batch are now available on the Des Moines Councilmember Youtube Channel. Go get ’em! Thanks to Councilmember Martinelli and Deputy Mayor Mahoney for supporting the idea. And of course,
...
continue reading.
Update 08/31/21: Since this original post, I have added two other proposals for a total of six. I’ve added them below. As I said in the Christmas in July post on spending our $9M in stimulus money, after the July 22 City Council Meeting, Councilmembers were given an application by the City Manager to fill
...
continue reading.
 HB1220 presentation from Eric Lane and Matthew Hutchins
Why moving the discussion on ARPA Stimulus funding from August 5 to September 16 is no improvement. As usual, it's all about transparency....
... [Continue Reading] ...
I occasionally hear from critics that I make too many things ‘public’. Why aren’t I trying to communicate with the administration or colleagues? The fact is that I do that. Whether I want to or not. 😀 My life as an elected in a very public and very hostile work environment sometimes remind me of
...
continue reading.
Like my colleagues, I’m sure, I’ve been thinking a lot about how to spend the $9M I discussed in my Christmas In July post. I’ve received dozens of messages about this. Many are very detailed proposals showing a concern for civic life that is seriously wonderful. And they spread the gamut. “More police!” to “no
...
continue reading.
At last night’s City Council Meeting, the City Manager unveiled the City’s ARPA Stimulus money proposal. In short, the City is receiving $9,000,000 to be used for a limited number of purposes and it must be spent by 2024. I urge all of you to watch that fifteen minute segment of the meeting and read
...
continue reading.